Book a Call
Case Study 01 IT Services & Software Development

IT Process Automation & Workflow Engineering

IT Services Company Saves 120+ Hours Per Month with Excel & Reporting Automation

120+ Hours Saved Monthly
85% Reduction in Manual Work
98% Reporting Accuracy
15m Report Delivery Time

Manual Reporting Bottlenecks

A growing IT services company was managing project tracking, resource allocation, timesheets, and client reporting through multiple complex Excel spreadsheets.

Every Week:

  • Project managers spent hours manually updating weekly progress reports
  • Team leads consolidated raw files from multiple departments
  • Executive leadership waited days for consolidated business insights
  • Frequent manual reporting errors created delays in project decisions

The company was spending over 30 hours per week on manual reporting alone.

Solution Architecture Workflow Diagram
Automation Workflow Architecture (Click to enlarge)

Custom Automation Ecosystem

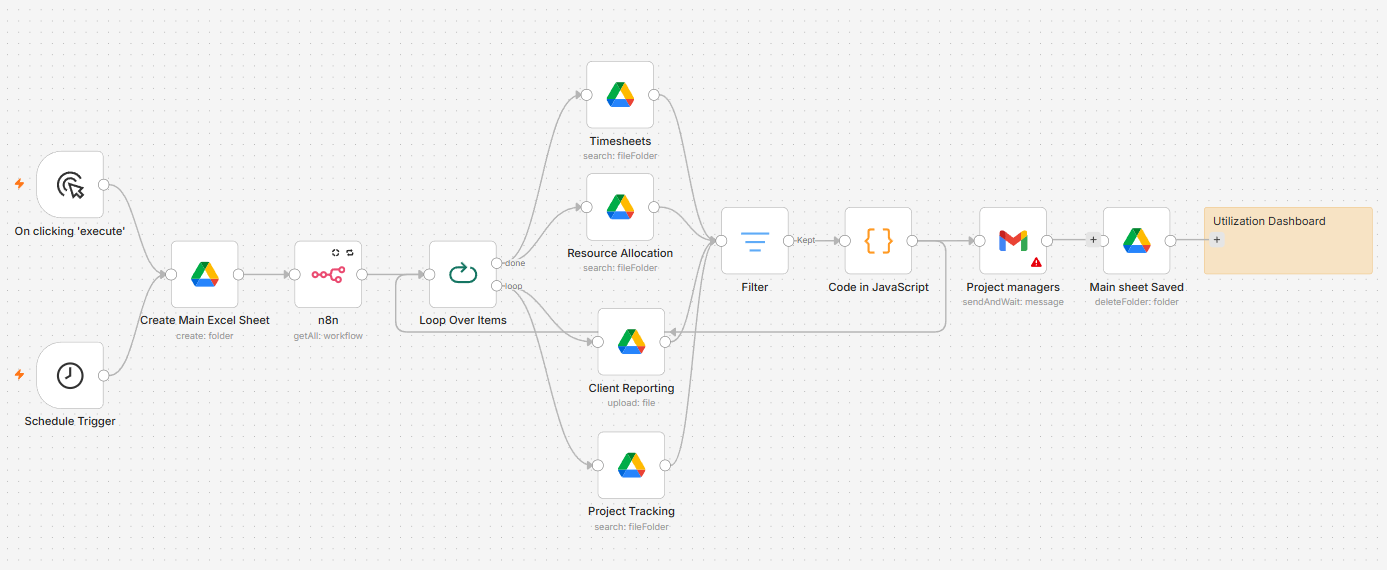
We developed a custom automation ecosystem tailored to consolidate departmental pipelines, streamline timesheet data, and auto-generate executive dashboards in minutes.

  • Excel & Google Macros Automation: Custom scripts run consolidation routines in seconds.
  • Automated MIS Reporting: Instant distribution queues format files correctly.
  • Project Tracking Dashboard: Real-time status views prevent delivery slipups.
  • Resource Utilization Dashboard: Instant tracking of employee hours vs client billing.
  • Automated Data Consolidation Workflows: Links accounting software directly with management reporting.
120+ Hours Saved
85% Less Manual
98% Accuracy

Implementation Timeline

Phase 1

Data Analysis

  • Reviewed 15+ complex legacy reporting Excel templates
  • Mapped manual cross-departmental reporting workflows
  • Identified repetitive structural tasks and bottlenecks
Phase 2

Automation Development

  • Developed custom JavaScript and Macro consolidation scripts
  • Engineered automated template parsing and formatting rules
  • Implemented one-click dashboard refresh utilities
  • Coded strict error-validation and alerts routines
Phase 3

Dashboard Creation

  • Built clean real-time executive KPI summaries and chart boards
  • Enabled active client project milestones status monitoring
  • Integrated granular team productivity and billing utilization analytics

Before vs After Automation

Performance Metric Before Senoiq After Automation
Weekly Reporting Time 30 Hours 4 Hours
Reporting Accuracy 82% 98%
Report Delivery Time 2 Days 15 Minutes
Manual Data Entry 100% 10%

Business Impact

120+ Hours Saved Monthly
85% Reduction in Manual Work
98% Reporting Accuracy
Faster Leadership Decisions
Next Case Study

AI-Powered NLP Chatbot

92% Faster Customer Responses

View Next Case Study

Ready To Automate Your Business?

Let's build intelligent systems that save time, reduce costs and help your business grow.